
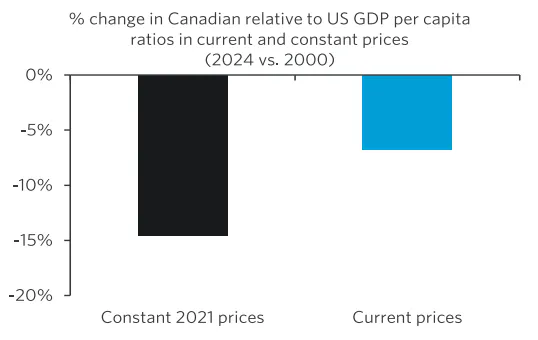
Chart 1: Relative GDP per capita ratio declined less since 2000 in current prices

Canadians have long been told that they are falling behind their American cousins in terms of economic well-being. Certainly, that shows up in stark gaps that have seen Canada trail its southern neighbour in growth in both GDP per capita and per hour worked. That disappointing performance is then attributed to under-investing, over-regulating, and lagging technological advancement, leading to a slow drift into second-class status next to its dynamic neighbour.
Make no mistake: the lacklustre productivity numbers are real, and certainly worthy of efforts to turn them around. But they aren’t the full story in terms of how Canadians are faring in terms of economic well-being. A more nuanced view shows that for most of this “lost era”, the GDP underperformance didn’t do as much damage to the market value of what Canada produced versus what we saw stateside, and after allowing for changes in income distributions, the “typical” Canadian did better at keeping pace with his or her American counterpart.
Paul Krugman reached similar findings when assessing changes in US and European economic conditions based on GDP statistics, in response to studies bemoaning Europe’s lagging productivity. His work inspired us to look into how Canada would stack up against American progress.
GDP measures the market value of output, and includes an inflation component that needs to be stripped out. The resulting real GDP data at constant chain-weighted prices are index numbers rather than absolute levels, but growth rates over periods of time can be compared.
Real GDP per capita, or per hour worked, has tended to show big productivity gains for countries like the US with large tech sectors, where each year’s chips, computers and other high tech products are much more powerful (and therefore count as more “real” output) than their predecessors. That’s one reason why both Canada and much of western Europe have lagged behind the US in trend productivity growth.
But what a country can actually buy each year, either at home, or through trade, from abroad, also depends on where prices for their goods and services sit relative to those in other countries. Although Canada’s terms of trade didn’t do as well after oil prices retreated in 2014, a hundred barrels of oil can still be exchanged for much more computing power today than in 2000. In effect, then, a country like Canada can benefit by trading what it produces for those tech goods that are getting, on a relative basis, ever cheaper in the quality adjusted prices used in GDP calculations.
So while Canada’s real GDP growth rate per capita has dropped by 14% relative to the US since 2000, the comparison doesn’t look as drastic in terms of the GDP in current prices. On that score, Canada’s per capita level experienced a less precipitous 7% decline relative to the US (Chart 1). (For the latter, following the conventional practice when comparing implications for living standards, we convert Canada’s nominal GDP into its US dollar equivalent at purchasing power parity exchange rates from the World Bank.) That’s still not great, but not quite as dire as what the real GDP trends would imply.
GDP per capita can improve by simply having people work more hours, giving up leisure in the process. GDP per hour worked is therefore a better measure of well-being, and here too, the data show that Canada’s relative performance held up better in current prices than constant prices. At constant prices, Canada’s GDP per hour fell by 19% relative to that of the US over 2000 to 2024, but by only 12% in current prices over that same period (Chart 2 left). Of concern, however, is that fact that in both series, the most recent years of available data have seen a steeper deterioration, with Canadian productivity falling off sharply after 2022. Moreover, converted at purchasing power parity into US dollars, Canada’s output per hour worked has consistently been 20-30% less than what the US is able to generate (Chart 2 right).

Having a larger and growing economic pie per capita is the first step in improving the economic well-being of a country’s residents, but how that pie is sliced up also matters. A Bank of Canada study (MacGee and Rodrigue, 2024) found that the top 10% of the income distribution accounts for up to two-thirds of the measured productivity gap between the US and Canada. Since compensation then ends up being more concentrated at the top in the US, the median Canadian doesn’t trail her US counterpart as much as the aggregate GDP data would suggest.
Canadians are highly educated overall, but the US economy, by featuring larger firms and a more significant booming tech sector, may be able to deploy those skills to greater benefit in terms of economic output. A top American lawyer will handle civil suits with larger total damages than their Canadian peer, a Wall Street professional will reap fees from bigger M&A or IPO deals than their Bay Street counterpart, and a tech executive can contribute more if they are managing a US giant than a smaller Canadian competitor. But these awards accrue at the top, and may have little impact on the median worker. Unionization rates can also impact how workers further down the income spectrum will fare.
Using the median personal income in the US by the Census Bureau and comparing that against the median total income by Statistics Canada adjusted for PPP, we find that Canada’s relative ratio of median personal income was still slightly better in 2024 than in 2000 (Chart 3). That said, it’s notable that the relative ratio increased steadily from 2000 to mid-2010’s but declined thereafter, so the trend in the last decade has wiped out most of the prior decade’s outperformance.

Personal incomes can shift due to decisions over labour force participation and changes in government transfer benefits. A purer measure of the rewards to working, median weekly earnings of full-time employees, adjusted for PPP, grew more in Canada than in US since 2000 (Chart 4). And in level terms, the median worker hasn’t been that far behind what the median American worker can buy with their wages.

The median workers in Canada were gaining on Americans during the commodities boom, and then lost ground after oil prices fell in late 2014. During COVID, Canada had implemented a broader generous safety net that lifted personal incomes for those near the median. Since COVID, the relative ratios of median weekly earnings and median personal income have declined steadily but still remain above 2000 levels as of 2024.
That’s also true for after-tax disposable incomes. As Chart 5 shows, the relative median disposable income ratio was at 0.85 in 2000 and grew to peak above 1 in 2014 before steadily declining to 0.97 in 2023 but remains above 2000 (data were not available for the US for some years). Note that the median Canadian likely receives more back from what they pay in taxes than their American equivalents, given the greater availability of public health insurance and subsidized post-secondary education.

In terms of disposable income, and therefore what a median worker can buy with their earnings at work, (at PPP exchange rates), Canadians aren’t really that far behind their American counterparts. But these days, Americans might have more spending power from their wealth gains, rather than incomes. Canada’s household sector (incl. nonprofits) net worth was about 450% of its net disposable income, while in the US it was about 517% in 2000 (Chart 6). By 2024, Canada had almost caught up to the same level as the US (670% for Canada vs 680% for US).

But that largely reflects the sharper appreciation in Canadian home values, and the larger share that real estate makes up in household net worth on the northern side of the border. Canadian home values appreciated sharply over the last two decades. But without downsizing, such wealth isn’t as easily tapped, and for younger Canadians, those house prices can be more of a curse than a blessing. On financial assets alone, Americans are indeed feeling richer relative to their incomes than Canadians. (Chart 7). Still, as is the case for incomes, that gap likely has less impact on the median family, given how unequally financial assets are distributed.

We asked in the title of this paper, “how bad is it?”. To sum up, Canadians as a group are still less productive than Americans in level terms, even when adjusted for the purchasing power of their currencies and relative prices. They also have a less bountiful pile of financial assets.
But growth in output per capita or per hour worked hasn’t trailed as badly when measured at current prices, likely due to the fact that some of the US gains are tilted to tech industries that produce more powerful products, but also ones that decline in quality-adjusted prices. Using PPP exchange rates also makes income gaps seem less dire, since market exchange rates understate what the Canadian dollar actually buys at home. And median workers and households aren’t quite as far behind those in the US as the GDP data suggest, since productivity and income gains stateside have been more concentrated at the top.
Still, recent years have seen considerable slippage on all of these trends in terms of how Canadians are doing versus their America neighbours. Arresting that relative decline remains a key policy priority, even if the typical Canadian isn’t quite as hard done by as the productivity gap might imply.

