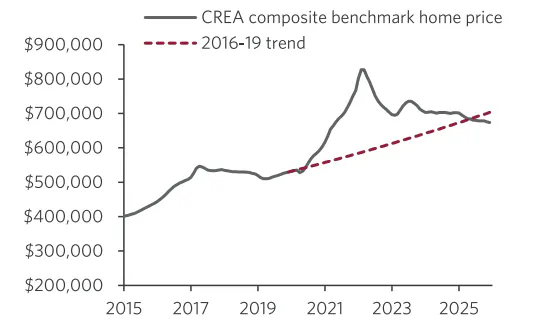
Chart 1: National benchmark home price close to pre-Covid trendline

The best way to describe the current state of the housing market is to say that prices are still too high to buy and not high enough to build. Yes, the decline in home prices since the peak of early 2022 is significant and it’s not over yet, but one can hardly claim that affordability in major Canadian urban centers is where it should be. Meanwhile the economics of homebuilding, mainly in the high-rise space, is simply broken. Without cutting the cost of new home deliveries significantly, things will not improve, in fact, they will get worse. Given the importance of the housing market to the economy, the current weakness in activity along with falling prices, have clear negative macroeconomic implications.
Chart 1 is a big picture illustration of the price trajectory of the Canadian housing market as a whole. After the meteoric ascent in home prices during Covid, the benchmark price is currently close to where it should have been if Covid was just a bad dream. But as is always the case, the big picture hides a lot of nuggets.
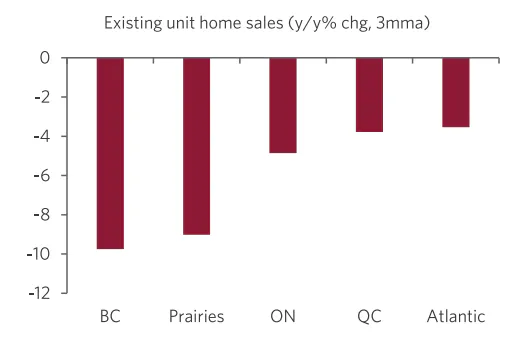
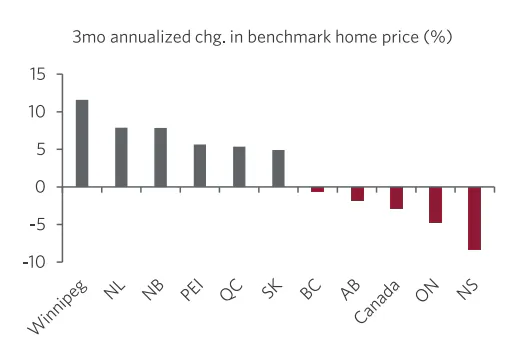
Until very recently, that picture reflected a much more dramatic correction in Ontario where the benchmark price is currently 28% below the trendline, while BC’s is 13% lower than it was in early 2022. At the same time, benchmark prices in the rest of the country are largely still above the trendline, led by Newfoundland and Labrador, Saskatchewan, and Alberta. That gap however, is starting to narrow. A significant drop in population growth and emerging affordability issues are slowing activity in Atlantic Canada and the Prairie provinces. New home sales are dropping notably in those regions, leading to the recent cooling in existing home sales, while home price inflation is slowing notably in many provinces, with Alberta and Nova Scotia already in negative territory (Charts 2 and 3).
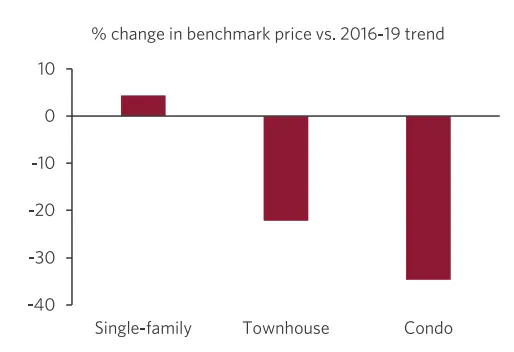
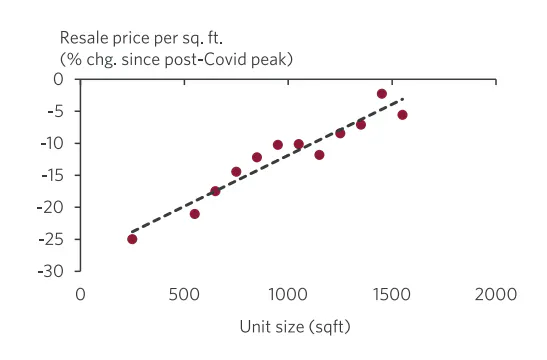
Another asymmetrical aspect of the correction can be seen amongst prices for different housing types. Here the most significant damage is clearly in the oversupplied condo market, where prices nationally are 35% below the trendline, after falling by 15% since the peak of early 2022 (Chart 4). Again, the most significant damage is in Ontario and BC while other centers start to show early signs of stress. Moreover, even here the softness is not uniform, with smaller units seeing a much larger correction (Chart 5).
While the economic impact of rising prices is behind us, the impact of falling prices has started to show up, and will be more apparent in the future. The following is a brief discussion of some of the more important vehicles in which the current correction in the housing market impacts the macro environment.
Housing starts— the headline numbers still present a picture of resiliency, with housing starts averaging a strong 260k in 2025, a solid increase of 5% from 2024. Even in the ground zero of the correction, the GTA and GVA, the numbers are much stronger than one would have expected given what’s happening in the field.
So how is it possible that housing starts are still so strong? The answer is that they are not. The housing starts data nationally and by province and cities are provided by CMHC. Now, when does a housing start actually start? According to CMHC, a start is a start only when the foundation reaches grade. That means that in most large multi-family cases, starts are being recorded 1-2 years after the start actually occurs (Chart 6). This means that the CMHC housing starts data represent decisions made 12-18 months ago, and is therefore a lagging indicator.
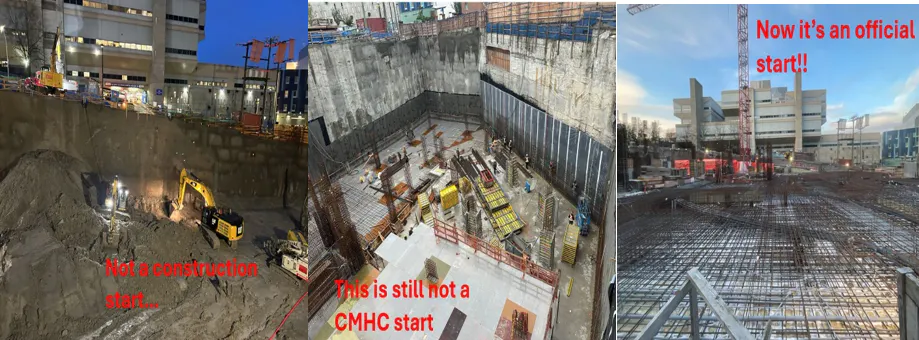
Now, in a normal and stable economic and housing market environment, this factor is not a major issue. But clearly, given the rapid change in the economic landscape over the past 18 months, that lag is significant. Simply put, today’s high rise housing starts statistics inform us about activity in late 2024, and not about the here and now.
Based on information obtained from Urbanation and Zonda, we suggest that in the GTA and the GVA, the real level of housing starts is roughly 50% and 30% below the headline numbers, respectively. And given the early signs of softness in other parts of the country, the gap between real and headline housing starts statistics is likely to grow.
What about using approvals as a leading indicator of near-term future activity? Here again one has to be careful. While recent approval numbers have been trending downward, the situation is even weaker than suggested by the headline numbers. Many developers, mainly in BC and Ontario, apply for an approval without a plan to act on it anytime soon. For example, in Vancouver the number of units approved but with no building permit rose from 19,000 in 2024, to 28,200 units in 2025. The equivalent number in the city of Surry is 44,300. We see a similar trend in Ontario in general, and in the GTA in particular. So the issue in many cases is not permits and zoning, it’s the economics of the project.
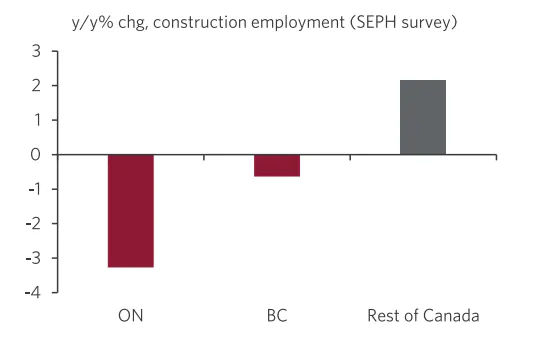
Construction employment— Overall employment in the construction industry has been flat for a while with the most impacted provinces of Ontario, and to a lesser extent BC, feeling most of the pain (Chart 7). But with the regional gap in activity starting to narrow, we expect country-wide construction employment to fall in the coming quarters.
Furthermore, here again things are more interesting than what the headline figures tell us. Many developers have chosen to hold onto their core labour supply (mainly trades), even if those workers spend all day playing cards. That of course is due to challenges associated with rehiring when the cycle turns. But that cannot last forever. What’s more, in many cases, the skill set of a residential construction worker is identical to what’s currently needed in the booming infrastructure sector, so many residential construction workers have been able to find alternative employment. While this works to limit the damage today in the headline employment numbers, it means that the future labour shortage in the homebuilding sector will get worse.
The wealth effect— a very familiar concept. Your stock portfolio and/or your house rises in value, you feel richer (on paper), and you increase your consumption based on this newly created wealth. And the opposite is the case where falling financial and/or real-estate values lead to softer consumption. It makes a lot of sense but quantifying that effect is nearly impossible— not that that has stopped many from trying. The Bank of Canada, in a widely cited paper from the early 2000s, suggested that the housing wealth effect accounts for a 5.7cent increase in spending for every dollar increase in home values. It also suggested that the wealth effect associated with financial gains is minimal.
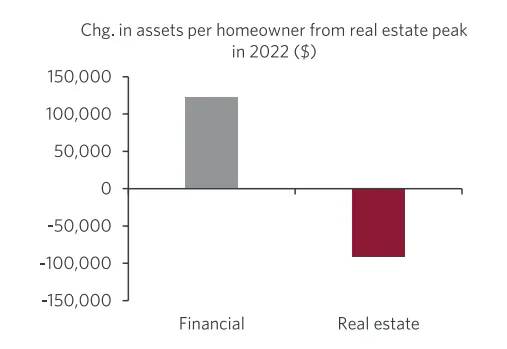
A more recent study from New Zealand suggested that the housing wealth effect is much more significant when home prices fall. In other words, the negative is larger than the positive. If the Bank of Canada is right, then the impact of falling house prices on consumption would be over $5000 per household, and if the New Zealand numbers are correct the damage would be roughly $3600. We are reluctant to use any of those numbers in our forecast but agree that the wealth effect is larger for housing assets than for financial assets, and that it is more significant when values fall. Therefore the decline in housing wealth will have a larger negative impact on the consumer than the positive impact of rising financial wealth (Chart 8). How large? We don’t know, but it’s not zero.
Borrowing against home equity— the upward trajectory in house prices over the past two decades was about much more than a psychological lift to consumers. It allows Canadians to approach their financial institutions confidently to ask for increased credit, using the gain in the value of their house as added collateral. While from a macro perspective, this is still an option, with the average loan-to-value ratio in the uninsured mortgage portfolio at around 55%, at the margin, this is becoming an issue.
As we have indicated in previous research, we estimate that close to 6% of the mortgage portfolio will face more than a 40% increase in mortgage debt payments upon renewal this year. Last year, many borrowers at the margin were helped by the fact that they had the option to refinance and ease the pain. That’s no longer the case for many in BC and Ontario, where home prices are below the level they were in 2021. While we do not view that as a major macro issue since many borrowers will actually face lower interest payments upon renewal this year, it is reasonable to expect a further increase in delinquency rates in the coming quarters.
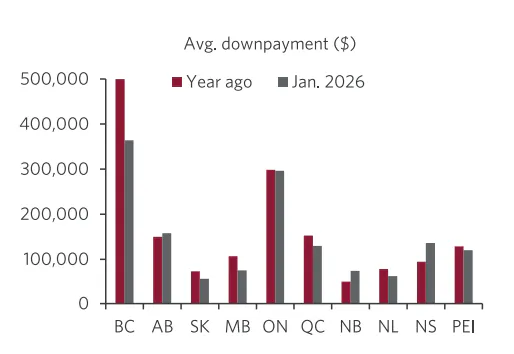
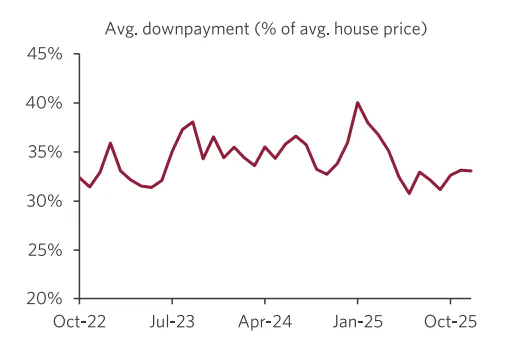
Affordability— so far we have discussed the negative impact of a slowing housing market, but there is of course a positive. Lower home prices means improved affordability for homebuyers – mostly first-time buyers. The average price nationally has dropped by $110K since the early 2022 peak, implying savings of $22K on a 20% downpayment for the average house. That theoretically will leave some room for extra consumption. In fact, the actual average downpayment nationally has fallen by $37K since the peak, and is 7ppts lower as a share of average home prices at 33%, which should work as a partial offset to the negative impact of lower prices on spending (Charts 9 and 10).
The economic cost of the correcting housing market is not trivial, with some headline statistics masking deeper damage. Housing starts are weaker than the official figures suggest, approval numbers can no longer be used as a reliable indicator of what’s in the pipeline, and the damage to construction jobs is more evident in the most impacted centres and it’s far from over, with the seeds for future labour shortages in the sector currently being planted. The negative wealth effect, although hard to quantify, is hurting consumer sentiment, while increased stress at the margin of the mortgage market means increased delinquency rates and reduced refinancing options. Improved affordability due to lower prices is a welcome development, but it is not large enough to offset the negatives nor is it the remedy to the country’s housing affordability crisis. The current soft patch in housing activity should be viewed as an opportunity to deal with the main reason for high shelter prices in Canada— the unsustainably high cost of homebuilding.